Exponential Functions-
The exponential function of
where
If you are wondering why
Graphs of Exponential Functions-
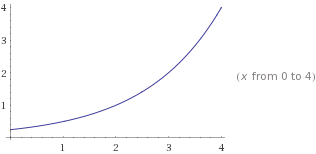
Below is the graph of
The basic characteristics of this graph are:
- Domain:
- Range:
- Intercepts:
- X-axis is horizontal asymptote as
- Increasing
- Continuous
It has all of the same basic characteristics as
Transformations of Exponential Functions
The form:
Reflections over the x-axis occur if the whole function is multiplied by a negative for example:
We have already seen how
This graph is the same as
The only basic differences are that the y-intercept becomes

This graph is the same a
The only difference is the y-intercept

The function is now decreasing and has the y-intercept of

Note: Translations in the y-axis also can occur when
The Natural Base e
The natural exponential function is:

It is convenient choice for many applications.
For large values of x, e can be approximated by the expression

Compound Interest
Compound Interest is a very common example of exponential growth where you earn interest on your interest
To calculate this use the equation:
P= Initial Investment
r= Interest Rate
n= Amount of compounds a year
t= Years
Continuous Compounding occurs when n increases uncontrollably to the point where compounding is continuous. To solve for this type of compounding use the formula:
where e


No comments:
Post a Comment