Showing posts with label Natural Base. Show all posts

Wednesday, February 12, 2014

3.2 Logarithmic Functions and Their Graphs

The logarithmic function f with base a is denoted as:
    f(x)=logax
where a>0, a≠1, and x is a real number.

The logarithmic function f(x)=logax is the inverse of the exponential function f(x)=ax.


 These are the graphs for f(x)=log10x (in blue) and f(x)=10x (in red).

Notice that that the logarithmic graph is a transformation of the exponential graph.


       THE KEY TO EVERYTHING


With a logarithmic function, y=logax implies that ay=x.

For example:
log24=2
implies that
22=4.

When evaluating logarithmic functions, it is important to keep this in mind.

For example:
   log5125=x
(We can solve for x by remembering The Key to Everything.)
   5x=125
(125 is equal to 53.)
   5x=53
(If 5 raised to the x power is equal to 5 raised to the 3rd power, then...)
   x=3
(...x is equal to 3.)


       THE PROPERTIES OF LOGARITHMS

  • loga1=0 because a0=1
  • logaa=1 because a1=a
  • logaax=x because ax=ax
  • If logax=logay, then x=y.

The natural logarithmic function, similar to the natural exponential function, uses the number e as a base.
   For example: f(x)=logex
The natural logarithmic function is also rewritten in this way:
f(x)=ln x where ln denotes loge.

The common logarithmic function is a logarithm with the base 10.
   For example: f(x)=log10x
The common logarithmic function is also rewritten in this way:
f(x)=log x where log denotes log10.


       GRAPHS OF LOGARITHMIC FUNCTIONS


Recall that the graph of the logarithmic function f(x)=logax is the inverse of the exponential function f(x)=ax.
The graph of a logarithmic function is its corresponding exponential graph reflected across the line y=x.


These are the graphs for f(x)=log10x (in blue), f(x)=10x (in red), and f(x)=x (in orange).

In order to graph a logarithmic function, you should first graph its corresponding exponential function. Because they are inverses, you can find the corresponding exponential function by switching the x and y values.


Additionally, because they are inverses, the domain of one function is the range of the other, and the range of one function is the domain of the other.

   For example:
The domain (the possible x-values) of the function f(x)=log x is (0, ∞).
Therefore, the range (the possible y-values) of the function f(x)=10x is (0, ∞).
The domain of the function f(x)=10x is (-∞, ∞).
Therefore, the range of the function f(x)=log x is (-∞, ∞).

Thursday, February 6, 2014

3.1 Exponential Functions and Their Graphs

3.1 Exponential Functions and Their Graphs:

Exponential Functions-

The exponential function of with base is denoted as


where , ,and is any real number

If you are wondering why , it is because it yields a constant function not an exponential function. 1 raised to any power will always equal 1.

Graphs of Exponential Functions-

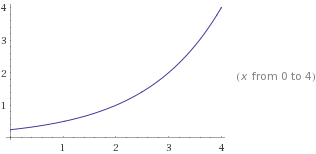
Below is the graph of 


The basic characteristics of this graph are:
  • Domain:    
  • Range: 
  • Intercepts: 
  • X-axis is horizontal asymptote as
  • Increasing
  • Continuous
Comparatively the graph of 


It has all of the same basic characteristics as however, the graph of   increases more rapidly.

Transformations of Exponential Functions
The form:
shows graph transformations more clearly.

effects how quickly the graph will either increase or decrease
effects up and down shifts in the graph
effects left and right shifts in the graph
effects reflections over of the y-axis
Reflections over the x-axis occur if the whole function is multiplied by a negative for example:

We have already seen how effects the graphs so let's begin with a shift up or down.

This graph is the same as  shifted but up 2 units
The only basic differences are that the y-intercept becomes and the horizontal asymptote becomes y=2


This graph is the same a shifted but shifted right 2
The only difference is the y-intercept


This graph is the same as translated across the x-axis
The function is now decreasing and has the y-intercept of

When the graph is translated across the y-axis and becomes decreasing
Note: Translations in the y-axis also can occur when


The Natural Base e
2.71828; e is the natural base
The natural exponential function is:


It is convenient choice for many applications.
For large values of x, e can be approximated by the expression  


Compound Interest
Compound Interest is a very common example of exponential growth where you earn interest on your interest
To calculate this use the equation:
A= Amount after interest
P= Initial Investment
r= Interest Rate
n= Amount of compounds a year
t= Years

Continuous Compounding occurs when n increases uncontrollably to the point where compounding is continuous. To solve for this type of compounding use the formula:
where e 2.71828